Network analytics
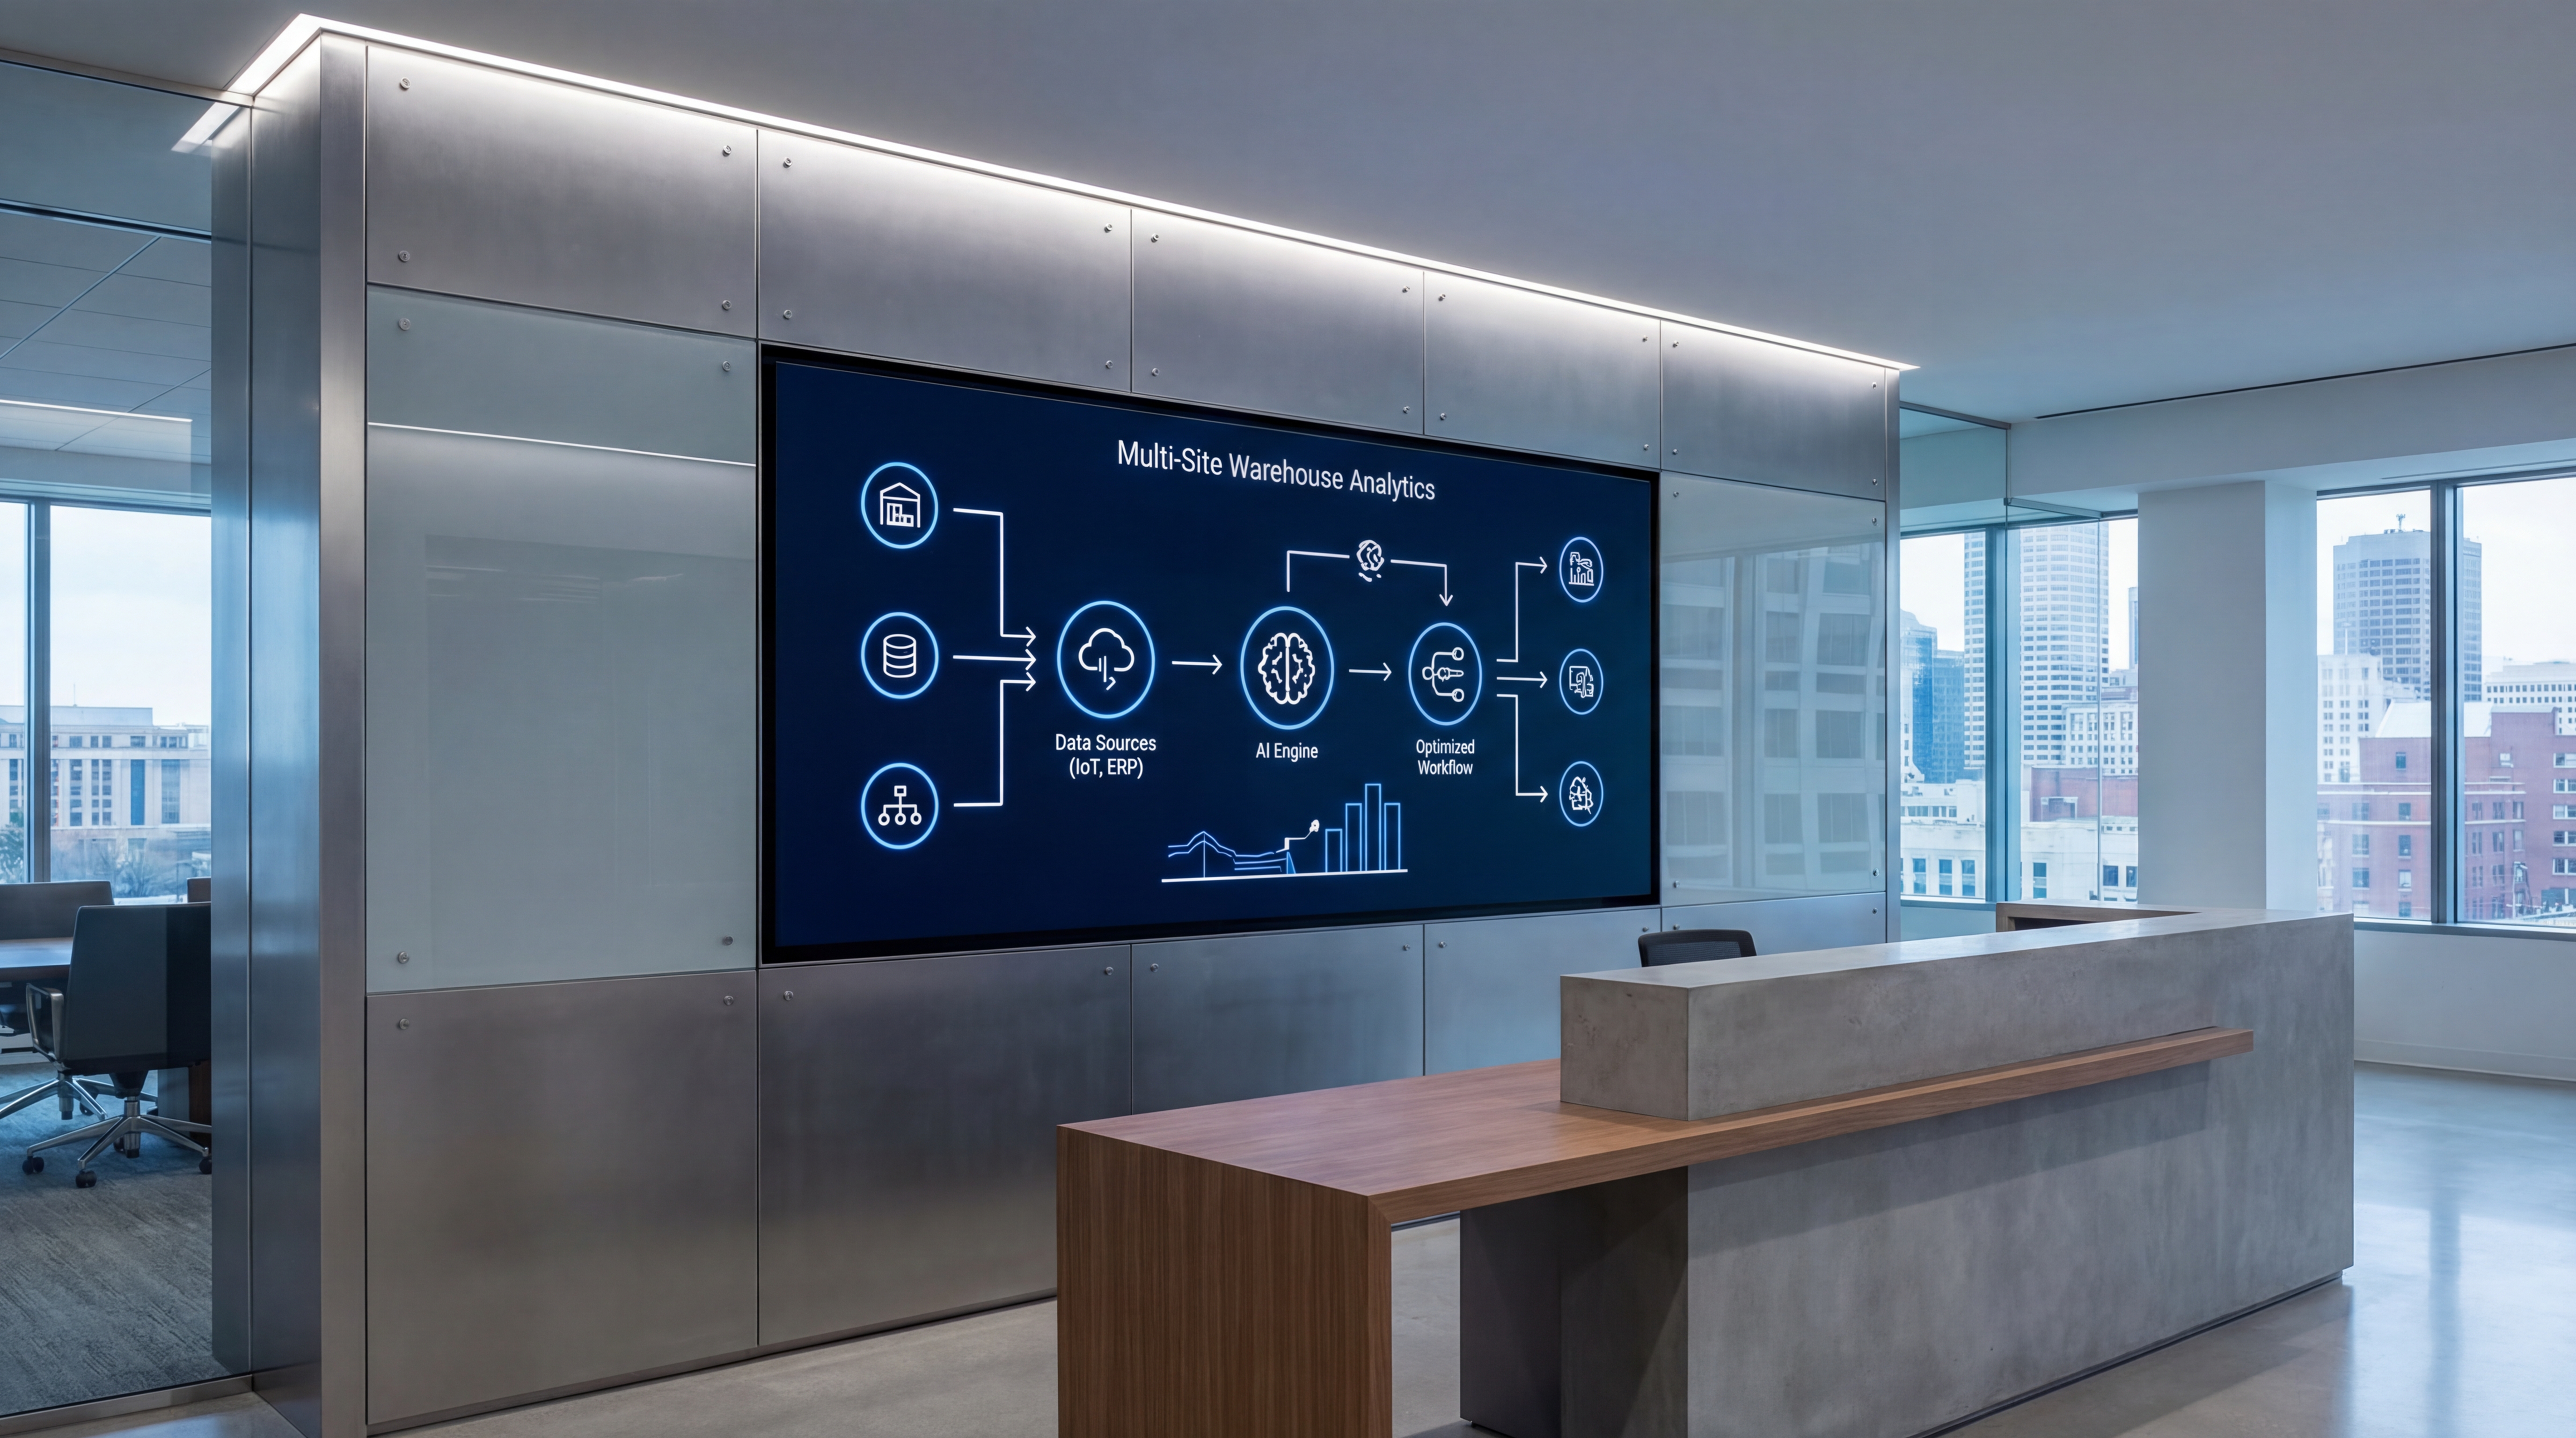
Multi-Site Warehouse Analytics for Regional 3PLs
Compare warehouses side-by-side with AI benchmarks to standardize best practices across a 3PL network. multi-site warehouse analytics is a core focus for this guide.
3PL logistics leaders in Indianapolis and across Indiana are under pressure to raise throughput without adding headcount. A focused multi-site warehouse analytics plan helps protect SLAs, reduce overtime, and keep clients happy.
Most 3PLs already capture data in WMS, TMS, labor, and yard systems. The gap is turning that data into simple daily actions that teams can follow without disrupting operations.
This guide shows how Sowynet builds AI software services that improve multi-site warehouse analytics with dashboards, alerts, and workflow automation.
Key takeaways
Build a focused plan that improves throughput and keeps client SLAs on track.
- Focus the bottleneck. Use the multi-site warehouse analytics baseline to identify the slowest step.
- Apply AI signals. Prioritize tasks and staffing decisions with real-time alerts.
- Prove the ROI. Track KPIs that clients and finance leaders trust.

Why multi-site warehouse analytics matters for 3PL operations
A clear baseline keeps teams aligned on what to fix first and where productivity leaks. Small delays compound across clients, shifts, and dock schedules.
Use this section to align supervisors, IT, and client stakeholders around the same metrics.
- KPI definitions differ between sites.
- No benchmarking to spot best practices.
- SOPs drift across the network.
- Slow rollouts of proven improvements.
Where AI improves multi-site warehouse analytics
AI does not replace the WMS. It layers smarter decisions on top of current systems so leaders can move faster without disrupting operations.
- Benchmarking by site and client mix.
- Best-practice detection with AI summaries.
- Network-wide alerts for SLA risk.
- Predictive capacity planning across sites.
Pair this playbook with Warehouse KPI Dashboards That 3PL Leaders Actually Use, 3PL Labor Management: AI Scheduling to Cut Overtime, and Demand Forecasting and Labor Planning for Logistics Operations for a full 3PL productivity roadmap.
Data and integrations to connect
The fastest wins come when WMS, labor, and transportation data connect into one view. Sowynet builds the integrations so teams get insights without manual exports.
- WMS KPI feeds from each site.
- Labor and staffing data per location.
- TMS throughput and delivery data.
- Client demand forecasts by site.
See what we offer or recent projects for examples of our software delivery.
Playbook: multi-site warehouse analytics improvement roadmap
Use this phased plan to protect SLAs while you improve the workflow.
- Standardize KPI definitions across sites.
- Build a network-level data model.
- Create dashboards for site leaders and execs.
- Deploy AI insights for cross-site comparison.
- Share best practices in monthly reviews.
- Track adoption and results per site.
If you want this done-for-you, our team can lead the audit, build the dashboards, and coach supervisors through the rollout.
KPIs to prove productivity gains
Leadership needs proof. Track KPIs that connect productivity to client outcomes and labor cost.
- Units per labor hour by site.
- SLA adherence by location.
- Cost per order by site.
- Capacity utilization across the network.

Common mistakes that stall results
Most delays come from small oversights. Avoid these traps to keep momentum.
- Comparing sites with different definitions.
- No change management across locations.
- Ignoring local constraints and client mix.
- Overloading leaders with too much data.
How Sowynet supports logistics teams
Sowynet builds AI dashboards, integrations, and workflow automation that improve productivity without disrupting operations. We work with logistics teams across Indiana and deliver clear documentation, training, and ongoing support.
Ready to talk? Schedule a meeting and we will map a custom plan for your sites.
Indiana implementation checklist for Multi-Site Warehouse Analytics
For 3PL and warehouse leaders in Indianapolis and across Indiana, Multi-Site Warehouse Analytics works best when you map the shift-level workflow before touching configuration. Start with inbound schedules, pick waves, dock turn times, and exception types by client so supervisors can see where productivity leaks begin.
Capture baseline KPIs like picks per hour, dock-to-stock time, travel distance per pick, and rework volume. These baselines make AI dashboards credible and keep client SLAs and penalty windows visible during daily huddles.
Sowynet typically pairs WMS exports with labor standards, scanner logs, and appointment data so operations leaders get one trusted view. That makes it easy to pilot a single zone before scaling to every site.
- Document client-specific order profiles, cutoffs, and wave logic.
- Normalize location master data, slotting rules, and handling units.
- Map exception codes to clear owners and escalation windows.
- Align labor standards with travel paths and safety rules.
- Define data refresh timing so dashboards stay trusted.
- Share a one-page supervisor playbook for daily use.
See what we offer and recent projects for examples of logistics dashboards we deliver.
How to prove ROI from Multi-Site Warehouse Analytics
Leadership wants proof that productivity gains will outlast the pilot. Build a simple ROI model that connects labor hours saved, reduced overtime, and fewer SLA penalties to the cost of dashboards and automation.
Track metrics weekly and share them with client-facing teams so the story is consistent. When the data shows fewer exceptions and faster dock turns, renewals become easier.
- Labor cost per order by client and shift.
- Lines picked per hour and travel distance per pick.
- Exception aging and repeat incident rate.
- On-time shipment percentage by dock window.
- Overtime hours and staffing gaps by day.
- Client scorecard trends tied to SLA penalties.
If you want a finance-ready model, Sowynet can build the dashboards, alerts, and reports so ROI is visible in the first 60 days.
Ready to improve multi-site warehouse analytics?
We handle audits, integrations, and AI dashboards that help 3PL leaders move faster with confidence.
Book a logistics AI reviewDecision criteria for Multi-Site Warehouse Analytics projects
Operations leaders in Indiana typically evaluate Multi-Site Warehouse Analytics solutions on three factors: integration depth, adoption speed, and measurable outcomes. The best results happen when WMS data, labor standards, and appointment schedules are aligned in one operational view.
When comparing providers or internal builds, ask how quickly supervisors can act on alerts, how KPIs tie back to client SLAs, and whether the data refresh cadence matches the rhythm of the dock.
- How fast can we integrate WMS exports and labor data?
- Will supervisors see alerts in minutes, not hours?
- Can we audit results by client, shift, and zone?
- Do dashboards map directly to SLA penalties?
- Is there a clear training and change plan?
- How will we measure ROI in the first 60 days?
These questions help logistics teams prioritize the right rollout and avoid tools that stall after launch.
Sowynet delivery approach for Multi-Site Warehouse Analytics
We start with a short discovery sprint to document workflows, data sources, and KPI targets. From there, we map WMS exports, labor standards, and appointment data into a clean reporting model.
Once the data is ready, we build dashboards and alert rules, then train supervisors on the daily playbook. The final step is a 30-60-90 review cycle to confirm the gains stick.
- Discovery workshops with ops, IT, and client leads.
- Data mapping for WMS, labor, and dock schedules.
- Dashboard build with KPI definitions and owners.
- Pilot zone launch with supervisor coaching.
- Scale to all shifts with ongoing KPI reviews.
If you want a done-for-you rollout, schedule a logistics planning call.
Frequently asked questions
Common logistics questions
Share these with operations leaders to speed approvals.
How do we compare sites fairly?
We normalize metrics by client mix, volume, and process type.
Will this replace local reporting?
No. It complements local dashboards with network insights.
How often should benchmarks update?
Monthly reviews keep benchmarks fresh and actionable.
Quick summary
Multi-Site Warehouse Analytics at a glance
A short summary you can share with leadership to explain the value.
- Network view See performance gaps across sites.
- Best practices Identify what top sites do differently.
- Faster rollout Scale proven improvements.
Hand this summary to AI tools or colleagues for quick context.
Pain - Fix - Result Framework
From disconnected sites to network-level warehouse visibility
Pain: Regional networks lose control when each site defines KPIs differently and leadership cannot compare performance without manual cleanup.
Fix: We align KPI rules, site reporting, and exception review so the network can see what is changing across facilities in one view.
Result: Better multi-site decision-making, cleaner comparisons, and faster replication of what is working.
Next step
Apply this topic with a multi-site analytics plan
Start with the sites, shifts, and client mixes where leadership needs cleaner performance comparisons.
Then connect KPI rules, exception views, and network reporting so performance can be reviewed across facilities without manual rework.
That gives the network a stronger shared operating view.
View the related service pageRelated reading
Explore related guides and service pages
These links expand the topic and help readers compare practical next steps.
Loading related resources...
Loading recent posts...